Latest economic forecasts for Japan, the U.S., Europe, and China, etc
In the U.S., adjustment of the excessive household debt has progressed and a foundation to accelerated growth is being developed. If political hurdles, such as Congress passing next year’s fiscal budget and raising the federal debt limit, are overcome, and if the sequester can be stopped at the end of September, high growth in 2014 and 2015 can be expected. Thus, there is a strong possibility that the FRB will announce a reduction in asset purchases under its third round of quantitative easing (QE3) in a meeting on September 18. Although a policy interest rate increase is not expected before 2015, long-term interest rates have started to increase in anticipation of a QE3 exit.
As a result, capital that once flowed into emerging countries in pursuit of higher interest rates is now starting to flow back into the U.S. Currencies in emerging countries including the Indian rupee and Brazilian real have weakened rapidly since June. The scale of external debt (% of GNI) in Thailand was 75% in 1997; meanwhile, the external debt in India and Brazil was 18% and 17% respectively in 2011, and the possibility of a recurrence of the Asian Currency Crisis is low. However, in these emerging countries, the decelerating business climate has become even weaker due to interest rate hikes in the name of currency protection.
In the eurozone, real GDP in the April-June 2013 period turned positive (1.1% annualized growth rate) for the first time in seven consecutive quarters. The growth was mainly driven by Germany despite the continuing economic recession in peripheral countries. The development of essential systems to maintain the common currency euro such as a banking union and economic integration has made little progress. Therefore, the situation is unlikely to change even after the German general election on September 22. Economic stagnation in Europe is expected to protract.
China has been barely affected by the inflow and reverse outflow of capital as the country regulates capital transactions. However, high growth resulting from raising capital input as in the past is unsustainable due in part to the decreasing productive-age population following the 2011 peak, expanding disparity in income, and growing environmental problems. The new Xi-Li administration is working on economic structure reform toward growth due to an improvement in productivity, and at the same time, they are attempting a soft landing at a 7% level of growth potential from the creation of demand by urbanization. Yet, the country is at risk of a sharp temporal decline in investment due to a decrease in the anticipated growth rate.
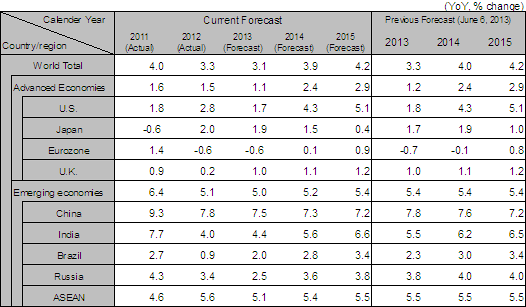
Real GDP growth rate for the world economy for 2013 is forecast to be 3.1%, which is 0.2% downwardly-revised from the previous forecast and slightly below the 3.3% rate for 2012. In the U.S., the real GDP growth rate for 2013 is estimated to be 1.7%, which is 0.1% downwardly-revised from the previous forecast; however, growth is expected to accelerate in the latter half of 2013 and beyond. For the eurozone, the forecast for the real GDP growth rate is -0.6% for 2013 and 0.1% for 2014. As such, economic stagnation is expected to continue. The real GDP growth rate for emerging economies is estimated to be 5.0%, which is 0.4% downwardly-revised from the previous forecast. India’s real GDP growth rate is forecast to be 4.4%, which is 1.1% downwardly-revised from the previous forecast, while 2.0% is estimated for Brazil and 7.5% for China, which are both 0.3% downwardly-revised from the previous forecasts.
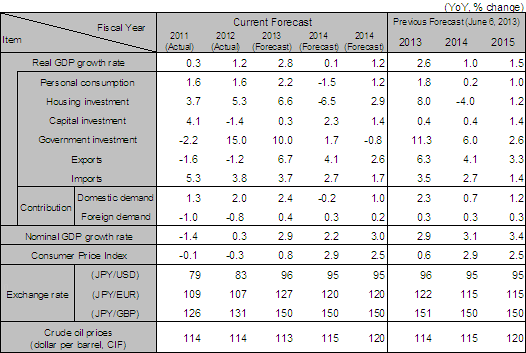
The Japanese economy had been in an economic slump since April 2012, but it hit bottom in November, and currently, the Japanese economy is in a phase of economic upturn. Japan’s real GDP growth rate had positive growth for three consecutive quarters in the April-June 2013 period at 2.6%.
There have been numerous opinions expressed such as, “If this trend continues, the effect of downward pressure on the economy resulting from the consumption tax rate increase can be overcome” and “Now is the best time to raise the consumption tax rate”, and this forecast as well uses a consumption tax rate increase from 5% to 8% in April 2014 and another increase from 8% to 10% in October 2015 as an assumption. However, due to the 3% increase in April 2014, the disposable income of households will decrease by 8 trillion yen. This is a 2.4 trillion yen (0.5% of GDP) decrease in effective demand if the marginal propensity to consume is considered as 0.3, which means there will be a large impact. This forecast assumes a 2 trillion yen addition in effective demand for the 2014 fiscal year with a supplementary budget containing tax reductions for investment, regulation reform, and investment in the public sector and other new economic measures. Based on this assumption, the growth rate for the 2014 fiscal year is estimated to be 0.1%, and recession is expected to be narrowly avoided. However, the deflation gap cannot be resolved by the end of 2015 fiscal year at this pace of growth; therefore, it is difficult to leave deflation behind and achieve the “2% inflation target” in approximately two years.
Prime Minister Abe is scheduled to make a decision on raising the consumption tax at the beginning of October, and this forecast may require review depending on the decision and new economic measures to be drawn up by the end of this year.

Note: Since the figures above are based on the calendar year, the figures for Japan are different from the fiscal-year based figures in the table below.
Source: IMF. Forecast by Hitachi Research Institute

Note: Since the figures above are based on the calendar year, the figures for Japan are different from the fiscal-year based figures in the table below.
Source: IMF. Forecast by Hitachi Research Institute