![]()
Latest economic forecasts for Japan, the U.S., Europe, and China, etc
In the world economy up to 2018, developed nations including Japan, the U.S. and Europe are likely to see steady growth, but the resource price slump will bring about a more noticeable growth gap in the emerging economies.
Between 2016 and 2018, growth will exceed the potential growth rate in Japan, the U.S. and Europe (Japan: 0.5%, the U.S.: 2.1%, Eurozone: 1.0%). The deflationary gap (difference between the growth potential and real GDP) is expected to be eliminated in Japan and the U.S. by 2018. The gap will still remain in the Eurozone, but will be narrower than before.
Among the emerging countries, China will see stable growth of 5% to 6% despite the economic slowdown. With reforms advanced by the Modi administration in India, the growth rate will surpass China, keeping in the 7% range. In ASEAN, with the growing middle-income group and promotion of industrial relocation within the ASEAN Economic Community (AEC), growth will be relatively steady compared to other regions, keeping at about 5%.
Driven by personal consumption, growth in the U.S. is steady at about 2.5%. FRB raised the policy interest rate by 0.25% on 16 December, 2015, and lifting of the zero-interest-rate policy is expected after seven years. Subsequent raises in the interest rate will be introduced gradually. Growth will also be backed by the highway development bill that was passed in December 2015, which will see $305 billion (0.3% of GDP per year) spent on highway projects in five years. While the crude oil price remains low, with the introduction of cost-cutting measures by shale oil producers, it is expected to remain at almost the same level after domestic crude oil production hits its ceiling. With weaker export competitiveness due to the strong dollar and higher economic growth than other countries, imports other than that for crude oil are expected to increase, and the trade deficit will expand slightly.
The Eurozone will see a gradual recovery at about 1.5%. Inflation will fall beneath the target of below but close to 2%. From 2016, ECB will continue to increase the amount of bond purchases and reduce the central bank current account interest rate further to the negative level. Austerity measures that narrow the year-on-year structural fiscal deficit of the Eurozone (except Greece) have paused, and recovery is seen in countries that were subject to the debt crisis, including Spain and Italy. However, banking union and fiscal integration, which are required for maintaining the euro in the long run, are not promising due to opposition from Germany. If agreement cannot be reached to reduce the principal of Greece’s loan, there may be a renewed crisis if Greece exits from the Eurozone. Meanwhile, if the election to vote for or against the U.K.’s withdrawal from the EU by the end of 2017 is held at a time when anti-immigrant sentiment is strong, there is a possibility that U.K. citizens may opt for the country to withdraw from the EU.
Based on official statistics, growth in China will be reduced to about 6.5% from 2016. It is anticipated that 6.5%, which is required to achieve the plan to double income (2010 to 2020), will be set as the new target in the 13th Five-Year Plan (2016 to 2020) to be announced in March 2016. The working-age population peaked out in 2010 and is currently on the decrease. China is planning to gradually slow down the growth rate through a structural transformation from a manufacturing-driven to a service-driven industry. Based on the actual figures, due to factors such as a dip in the growth in investment arising from consolidation of the excess production capacity and declining housing prices, coupled with other factors related to the business cycle, a sharp decline is expected from 7.3% in 2014 to about 5% in 2015 and 2016. With the Chinese government further expanding its infrastructure investments and advancing monetary easing in 2016, the economy is expected to bottom out in the same year, with the official statistics coinciding with the actual figure by 2018 at 6.4%. The yuan’s exchange rate against the dollar is tied to the interest rate, with the yuan remaining weak until 2016, after which it will appreciate against the dollar.
Due to factors such as continued monetary easing, measures in tandem with the TPP, which is scheduled to take effect in 2017, and construction work for the 2020 Tokyo Olympic Games, Japan’s average yearly growth between FY2016 and FY2018 is expected to be 0.9%, which exceeds the potential growth of 0.5%. In FY2016, the growth rate is anticipated to be as high as 1.5% in view of last-minute demand prior to the consumption tax increase in April 2017, but negative growth of -0.3% is expected in FY2017 due to a reactionary fall in demand. Assuming that additional monetary easing measures are introduced in FY2017, including an increase in the amount for ETF purchases and lowering the policy interest rate to a negative level, the economy will mark 1.5% growth by FY2018 and the deflationary gap will be eliminated. Due to the tight labor supply-demand balance, the ratio of non-regular employees will hit its ceiling. Growth of employees’ income will rise, which will provide support to an increase in personal consumption and housing investments.
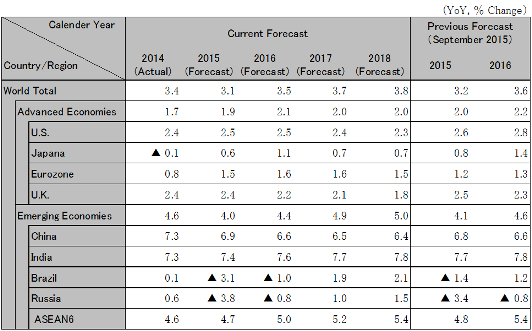
Note: The figures above are calendar-year. Accordingly, the figures for Japan are different from the fiscal-year based figures in the table below.
Source: IMF. Forecast by Hitachi Research Institute
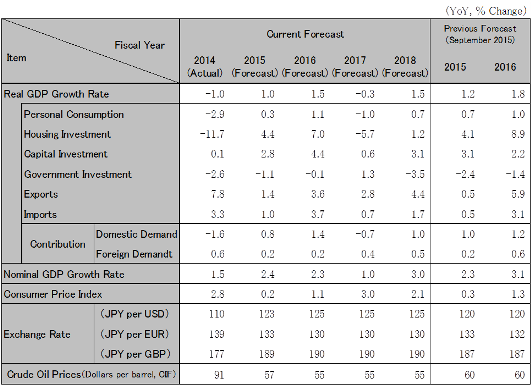
Source: National Accounts, etc. Forecast by Hitachi Research Institute.