![]()
Latest economic forecasts for Japan, the U.S., Europe, and China, etc
World economy will slow down in 2019, with further downside risk
The world economy is expected to slow down, from 3.6% in 2018 to 3.5% in 2019. After 2020, advanced countries and regions including China are likely to continue decelerating, while industrializing countries such as India and Vietnam are likely to maintain solid growth. Risks that can push the economy downward are: (1) disorderly Brexit, (2) U.S.-China trade war, and (3) crisis of emerging countries. (1) Brexit: Failure to reach an agreement on Brexit in the British Parliament could result in a disorderly Brexit at the end of March 2019; (2) U.S.-China trade war: Though truce has been agreed by both nations during the negotiation period until the end of February 2019, the frictions are likely to continue and expand due to there being no prospect of an agreement; (3) Crisis in emerging countries: Risks of currency crisis are expected to increase in current-account deficit countries such as Turkey and Argentina if U.S. long-term interest rates rise. If the global economy slows down more rapidly than anticipated and demand for resources such as crude oil decreases, there is a risk of negative growth in resource economies including Brazil and Russia due to a continued resource price decrease.
The US growth rate is expected to slow to 2.3% in 2019 from 2.9% in 2018 when it was pushed up by fiscal expansion, including tax reform and defense spending increase. The negative impacts of high tariffs imposed since March 2018 have become apparent in the forms of a higher tax burden on Americans as a result of higher tariffs and a decline in exports to China. The potential growth rate is forecasted to slow to the upper 1% range in the January-March quarter 2019. In the run-up to the 2020 presidential election, the government is expected to abolish high tariffs to prevent the economy from deteriorating. On the other hand, failure to raise the debt ceiling in the midst of political turmoil could trigger a US debt default in around August 2019, leading to a financial crisis.
Even if the U.K. succeeds in avoiding a disorderly Brexit, the potential growth rate which was at around 2% is expected to decline to the lower 1% range, 1.3% in 2018, 1.4% in 2019, 1.3% in 2020, and 1.3% in 2021. The British Parliament is expected to pass the proposed withdrawal agreement after amendment by January 21, 2019. However, in the case that the vote results in a disorderly Brexit in March 2019, there is a risk of stagnant flow of manpower, goods, and capital in and outside the U.K., pushing down the overall European economy.
The Euro zone potential growth rate is expected to slow to the mid-1% range, from 1.9% in 2018 to 1.7% in 2019, 1.6% in 2020, and 1.6% in 2021. Economic deceleration overseas including in the U.S. and China is expected to restrict the growth of external demand-dependent economies such as Germany. Italy, headed by a Euroskeptic administration, might clash with the EU over fiscal policy rules, which poses the risk of a recurrence of the EU debt crisis.
China is expected to follow a moderate slowdown to 6.6% in 2018, 6.2% in 2019, 6.2% in 2020, and 6.0% in 2021. Business confidence is falling sharply due to the U.S.-China trade war. The government has already implemented a tax reduction equivalent to 1.5% of GDP in the value-added tax and personal income tax, etc. The People's Bank of China also cut the deposit reserve rate for the third time in October 2018, shifting its policy to focus on economic measures. To cope with a possible decrease in exports to the U.S., a further stimulus measure is being prepared. At the Central Economic Work Conference scheduled to be held from December 19 to 20, 2018, the 2019 growth target was lowered from around 6.5% in 2018, suggesting an acceptance of a slowdown. A sharp slowdown may be avoided due to an expansion of consumption and real estate investment owing to rural income increase, etc.
While Japan is expected to grow at 0.9% in fiscal 2018, driven by personal consumption and capital investments, growth will decelerate to 0.7% in fiscal 2019 due to the consumption tax hike in October. The growth rate is 0.5% in fiscal 2020 and 0.7% in fiscal 2021. Along with the increase in the consumption tax rate, Japanese government is ready to spend funds above the tax increase on measures such as reduced tax rate on food, free nursery service, premium gift certificates, point rewards for cashless purchasers and automobile and housing tax cuts. However, most of these measures have limited impact to accelerate consumption and an inflationary gap is expected to turn into a deflationary gap in the second half of fiscal 2019. With the inflation rate below the target of 2%, the BOJ is expected to continue the long- and short-term interest rate control by purchasing assets. If the U.S. shows signs of deceleration and the Fed turns to lower interest rates, the BOJ will not have the leeway to lower interest rates, which may lead to further appreciation of the yen as the U.S.-Japan interest rate difference shrinks.
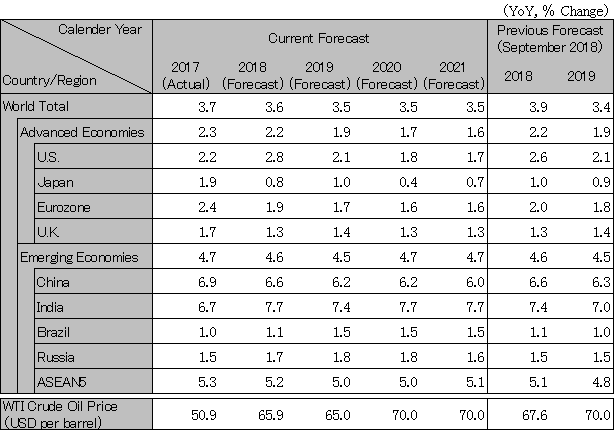
Note: The figures above are calendar-year based. Accordingly, the figures of Japan are different from the fiscal-year based figures in the table below.
Source: IMF. Forecast by Hitachi Research Institute.
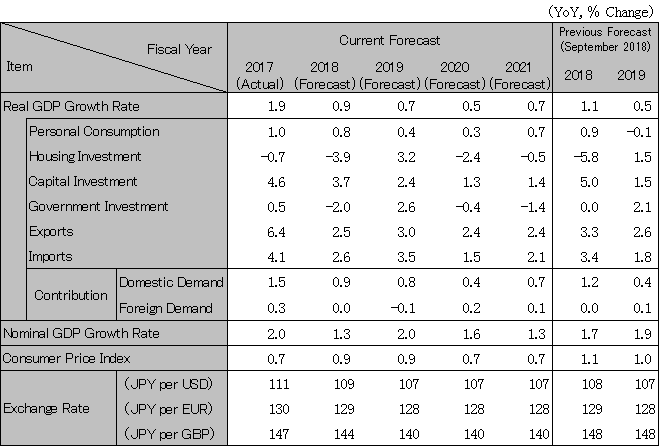
Note: Consumer Price Index excludes influence of the consumption tax rate increase.
Source: Japan Cabinet Office, etc. Forecast by Hitachi Research Institute.