Mar 18, 2019
Growing Signs of a Slowdown in the US, China, and Europe and Increasing Uncertainty in Japan
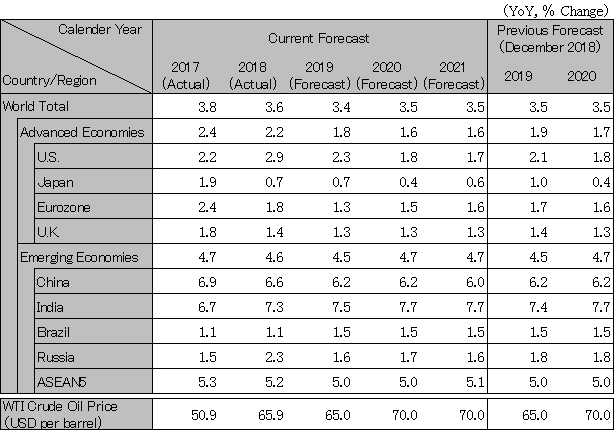
Global growth is expected to slow to 3.4% in 2019 from 3.6% in 2018. Demand for smartphones and data centers, which had been strong until 2017, has run its course, and manufacturing activity in major countries is now showing a downward trend after reaching its peak around early 2018. In China, signs of slowing activity have intensified since the beginning of 2018, partly due to a decline in lending on the back of tighter financial supervision. Europe’s economy also has been facing a sharp slowdown since the summer of 2018 as the result of decreasing exports to the UK and China. In the US, trade friction with China started to bite economically after the autumn of 2018, with the growth rate dropping from over 3% seen for two consecutive quarters to 2.6% in the October-December quarter 2018.
The US Federal Reserve Board announced in January 2019 that it would review the pace of rate hikes. According to the median forecast of Federal Open Market Committee members, two hikes in 2019 and one in 2020 had been scheduled as of December 2018. It is expected that one hike in 2019 will mark the end of rate increases. Although the risk of a currency crisis in emerging economies decreased with declining US long-term interest rates, the risk of the yen’s appreciation has increased for Japan (we revised our forecast for USD/JPY from 107 yen previously to 105 yen).
This forecast is based on the assumptions: (i) the US and China will come to an agreement to end their trade war when both leaders meet in spring, with their high tariffs abolished by the end of this year; and, (ii) crude oil prices will return to around 60 dollars per barrel due to supply constraints led mainly by the slower pace of US shale production growth.
After the United States demonstrated a high growth of 2.8% due to fiscal expansion, it is expected to decelerate to 2.1% in 2019, 1.8% in 2020, and 1.7% in 2021, toward a potential growth rate in the upper 1% range. Automobile sales and housing investments have peaked. The outlook assumes taxes currently imposed on USD 38 billion of steel and aluminum plus the high tariffs on China amounting to USD 250 billion will be withdrawn in 2019. However, if the U.S. expands the items subject to high tariffs to an additional USD 250 billion on China, and automobiles and automotive parts amounting to USD 330 billion, and imposes such tariffs until the end of 2019, GDP growth will be dragged down by 1 percentage point. There is a risk of economic recession in 2019, if these were to coincide with other negative shocks such as a stock price adjustment. Due to the economic slowdown in the first half of 2019, the FRB will end the quarterly 0.25% interest rate hike in June 2019 after reaching the economically neutral level of 3%. As a result, the long-term interest rate (10-year treasury bond interest rate) maintained at around 3% is expected to end the appreciation of the dollar, and the spread of currency crisis among emerging countries will be avoided.
In the UK, the potential growth rate is forecasted to drop to the lower 1% range of 1.4% in 2018 and 1.3% in 2019 from the previous norm of around 2%. It is assumed that the EU will continue to make revisions to the Brexit deal even after the EU summit on 21 March, 2019, and that the deal will pass through the UK parliament just in time for the end-March deadline. However, in the event of a No Deal Brexit, the UK economy would contract by around 3-8% (estimated by the Bank of England), while the euro zone would also suffer an economic downturn on the back of a sharp drop in exports to the UK.
The euro zone's growth rate is likely to decelerate sharply from 1.8% in 2018 to 1.3% in 2019, below its potential growth rate of middle of 1%. In Germany, manufacturing production fell from the previous year as a result of a slowdown in exports to UK and China, while in Italy, banks struggled with disposals of nonperforming loans, leading to a recession. The ECB is not likely to be in the position to raise interest rates during 2019. While the fiscal policy looks likely to shift from neutral to stimulus, policy changes will require a certain amount of time.
China’s economy is forecasted to slow to 6.2% in 2019 from 6.6% in 2018. US-China trade friction began to adversely affect China’s exports in the October-December quarter 2018. The government implemented tax cuts equivalent to 1.5% of GDP in such areas as value-added tax and personal income tax in 2018. The People's Bank of China also cut reserve requirement ratios in January 2019 for the fourth time since the beginning of 2018. The government plans to roll out economic stimulus measures centered on supporting consumption, including further tax and fee cuts equivalent to 1.6% of GDP in 2019, and resuming tax cuts and subsidies on cars and appliances in an attempt to achieve both a move towards a consumption-driven economy and a soft landing for the economy.
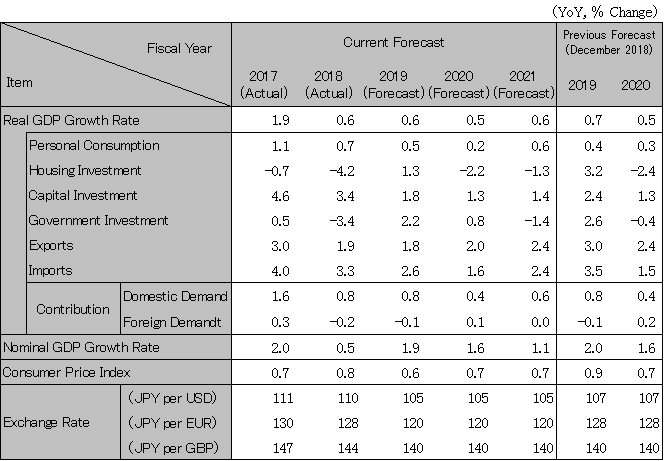
Japan’s economy grew by 0.6% in fiscal 2018. While the economy is likely to grow by 0.9% in the first half of fiscal 2019, partly due to negative growth in the July-September quarter previous year caused by the flooding disasters, it is expected to slow to 0.4% in the second half following the consumption tax increase. The slowdowns in overseas economies, including China, have led to lower export growth, and corporate earnings have been leveling off, subduing capital investment. On the other hand, government investment should expand with increasing public works to respond to natural disasters. Consumption should remain firm, supported by a demand boost ahead of the consumption tax hike, but would fall more than offsetting increases after the hike as a result of a decline in real purchasing power. Real GDP would return to the below potential level, i.e., re-emergence of a deflationary gap. With the inflation target of 2% not being met, the Bank of Japan would continue to control long-term and short-term interest rates through asset purchases.

Note: The figures above are calendar-year based. Accordingly, the figures of Japan are different from the fiscal-year based figures in the table below.
Source: IMF. Forecast by Hitachi Research Institute.

Note: Consumer Price Index excludes influence of the consumption tax rate increase.
Source: Japan Cabinet Office, etc. Forecast by Hitachi Research Institute.
We provide you with the latest information on HRI‘s periodicals, such as our journal and economic forecasts, as well as reports, interviews, columns, and other information based on our research activities.
Hitachi Research Institute welcomes questions, consultations, and inquiries related to articles published in the "Hitachi Souken" Journal through our contact form.